How a Multi-Location Dental Practice Went From a Fake Traffic Spike to Sustained, Compounding Organic Growth
(Client name changed for privacy.)
When Riverbend Dental Group came to us at the end of 2025, their previous SEO vendor’s reporting looked, at a glance, like a success story. Tens of thousands of organic clicks a month. A dashboard full of green arrows.
There was just one problem: the phones weren’t ringing any more than before, and the practice wasn’t seeing new patients show up because of it.
That disconnect was the first thing we checked when we pulled Google Search Console data for the handoff. It’s the kind of gap real SEO services are supposed to close, and what we found explained everything.
What We Found
A full audit of the account’s search history turned up a pattern that doesn’t happen naturally:
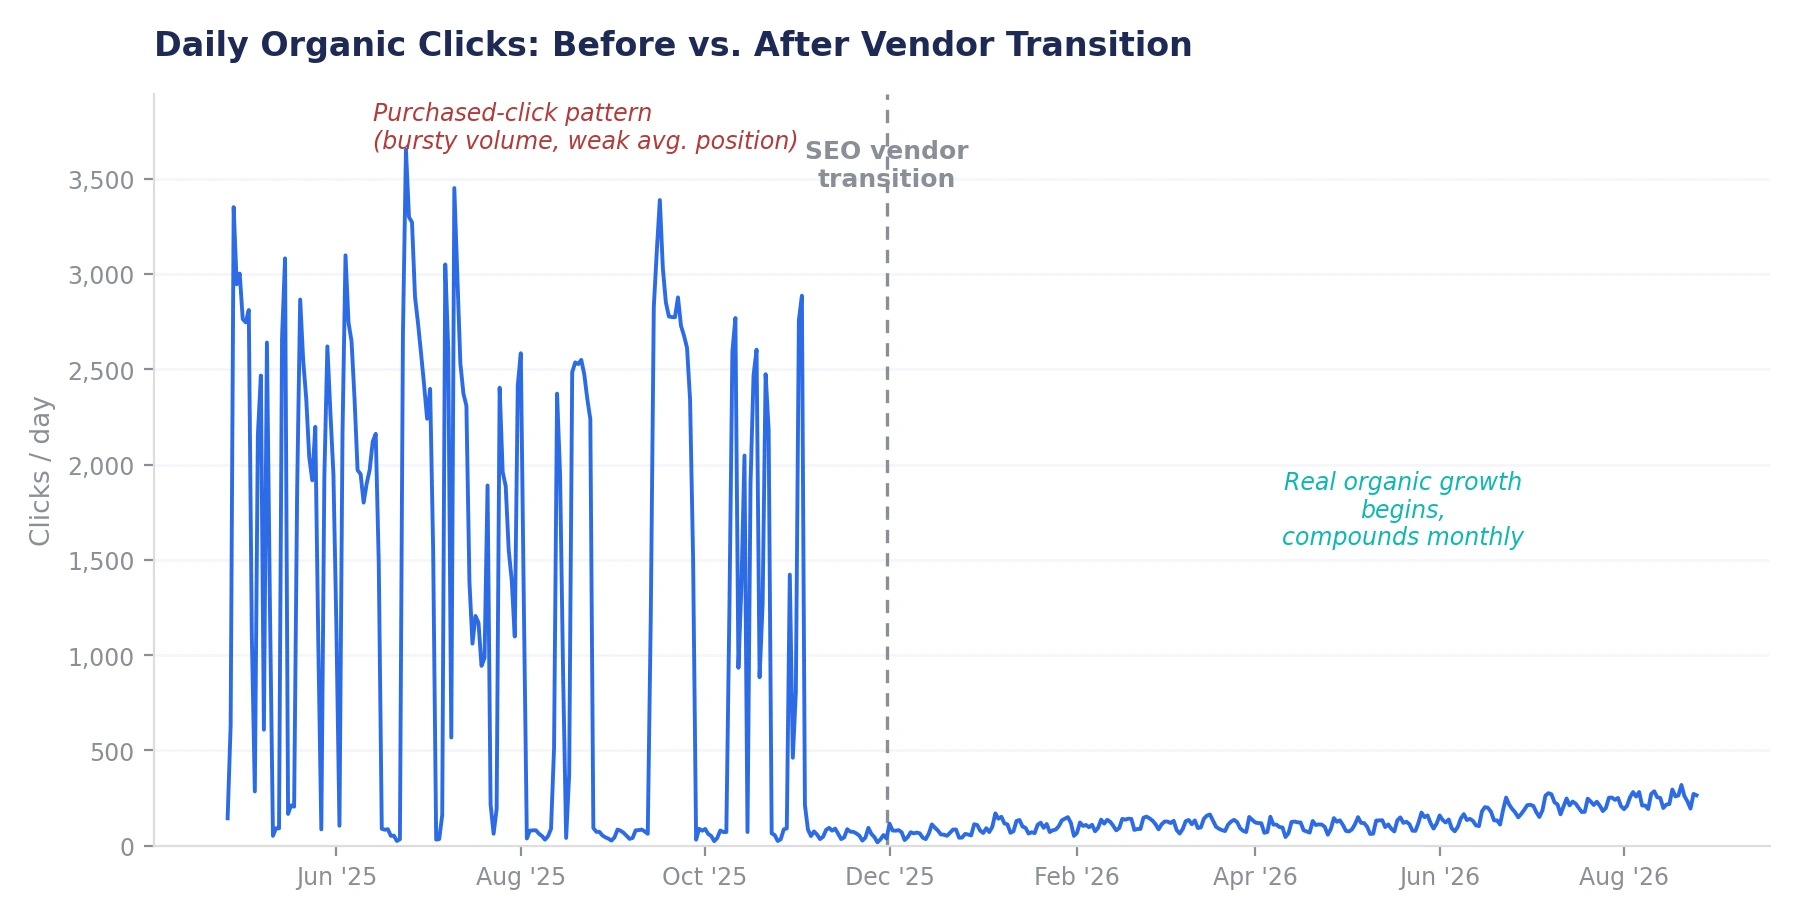
- Traffic that defied the math. The previous 90 days showed tens of thousands of monthly clicks at an average ranking position in the low-to-mid 20s, with a click-through rate north of 14%. Real organic traffic doesn’t behave that way. A page sitting in position 20 to 25 earns a click-through rate closer to 1 to 2%, not 14%. The clicks were real numbers on a real dashboard. They just weren’t coming from real searchers.
- A boom-and-bust daily pattern. Clicks spiked into the thousands for a stretch, dropped to near zero, then spiked again, over and over, for months. That kind of on-off volume is a signature of purchased or automated traffic, not the gradual curve real search demand produces.
- Thin coverage everywhere that actually mattered. Despite the inflated numbers, the practice’s main Google Business Profile was incomplete and inconsistent, several service and location pages were missing or thin, and there was almost no informational content answering the questions patients actually search before booking (what to expect from a filling, how long whitening lasts, what causes jaw pain, and similar).
- No real local footprint to match a multi-location practice. A group with several offices across its metro needs each location to earn its own visibility. That work simply hadn’t been done.
The client’s own words summed it up best: the traffic looked great on paper, but it wasn’t turning into patients.
What We Did
We took over at the end of November 2025 with one clear mandate: stop chasing a vanity number and build a search presence that actually brings people through the door. That meant starting over on the fundamentals.
- Rebuilt and optimized the practice’s main Google Business Profile. Consistent categories, services, hours, photos, and Q&A on the primary listing mattered as much as anything on the website itself. This became the highest-leverage work in the first few months.
- Filled the location-page gaps. Every office got a complete, unique service and location page rather than duplicated boilerplate, so each one could compete for its own local search intent.
- Built an informational content engine around real patient questions. Blog content was mapped to the pre-treatment and pre-booking questions patients actually search: symptoms, recovery timelines, procedure comparisons, and cost or process explainers across the practice’s priority service lines.
- Cleaned up on-page and technical fundamentals across every page we touched: metadata, internal linking, heading structure, and schema markup, done consistently rather than only on flagship pages.
- Ran monthly keyword and competitive research to keep the content calendar responsive to what was actually moving in the category, instead of working off a plan set once and left alone.
- Left the purchased traffic behind entirely. No paid-click shortcuts, no vanity metrics. Every subsequent number in this case study comes from real searchers finding the practice organically.
The Results
We’re only counting what happened after the switch to an organic-first strategy. The inflated numbers from the previous vendor are excluded entirely, they were never real demand, so they would make a dishonest baseline.
Average Search Position Improved by Roughly 15%
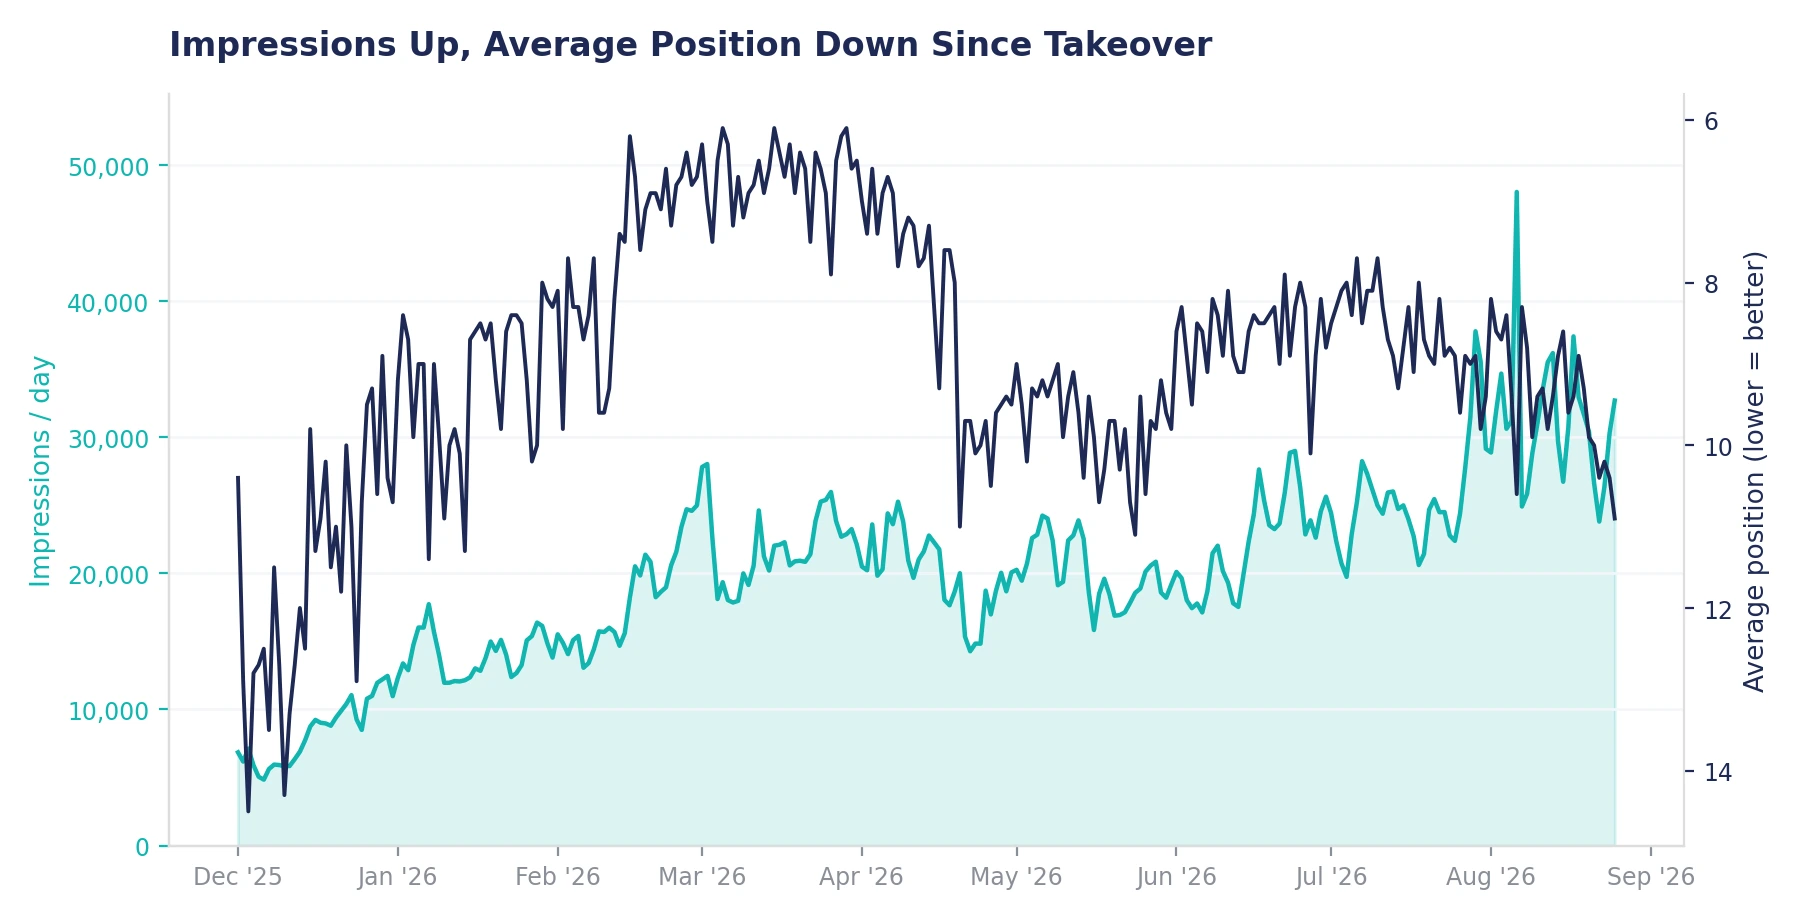
Across the ten months since the transition, average position improved from about 9.6 to 8.9, while daily impressions climbed from roughly 8,300 to over 31,000 a day. Impressions and position moving together like this is what real, earned visibility looks like: more of the right searches are finding the site, and it’s ranking higher when they do.
Organic Clicks Up 112% in the First 90-Day Comparison
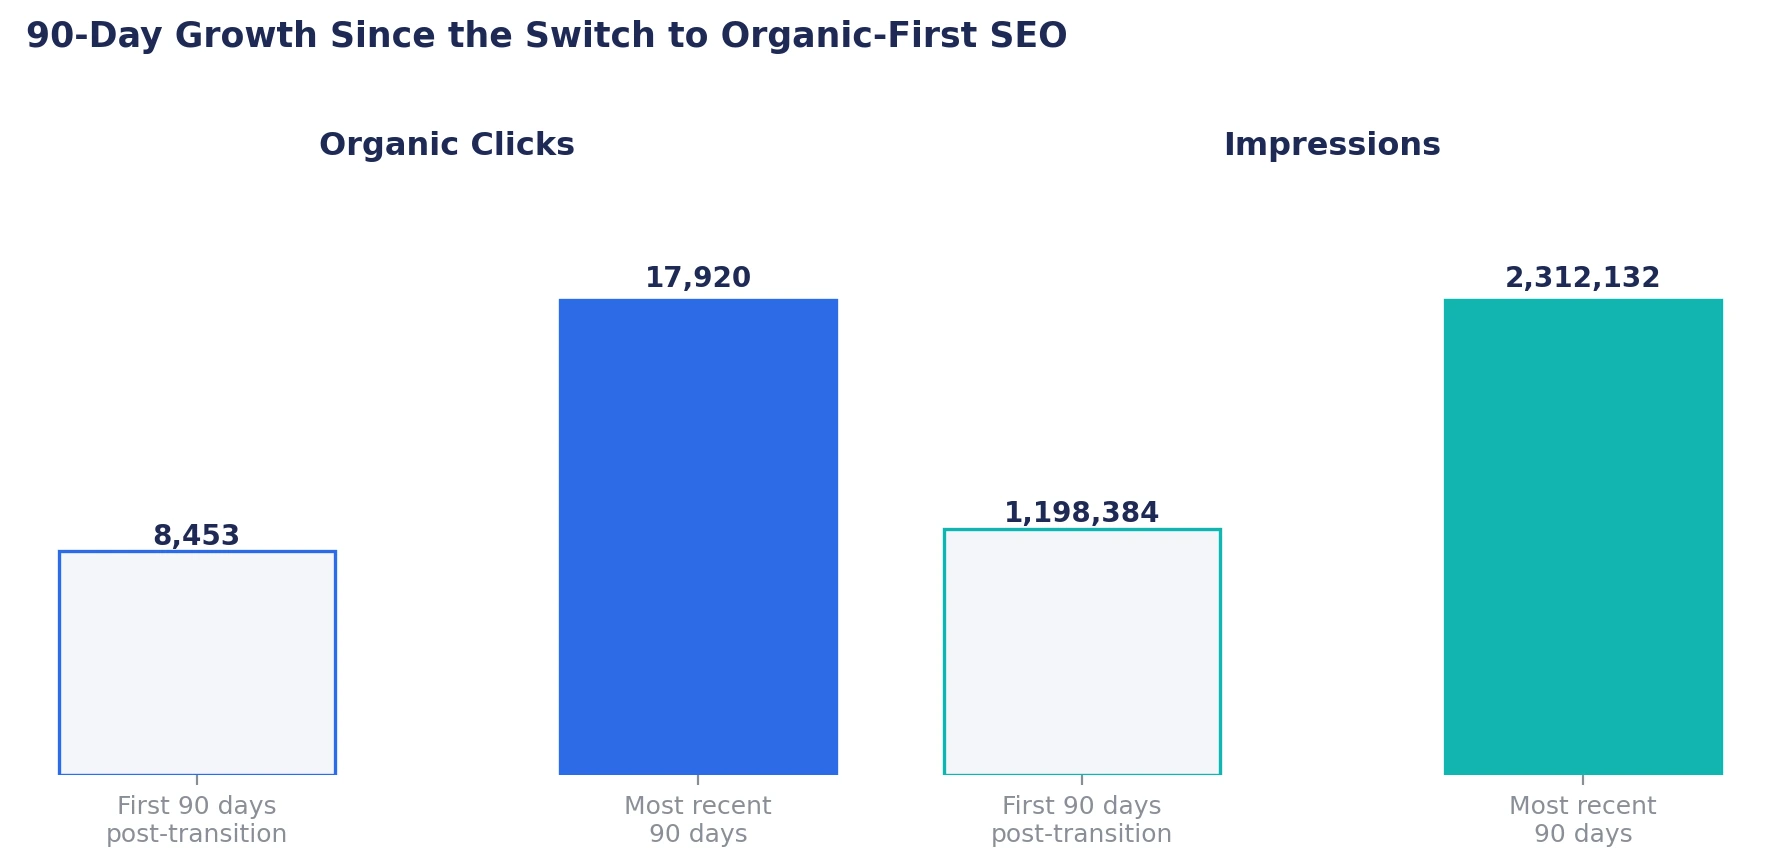
Comparing the first 90 tracked days after the transition to the most recent 90 days:
- Organic clicks up 112% (8,453 to 17,920)
- Impressions up 93% (1.2 million to 2.3 million)
- Daily average clicks up roughly 3.6x (about 69 a day to about 244 a day)
- Daily average impressions up roughly 3.8x (about 8,300 a day to over 31,000 a day)
This is the shape a real SEO campaign is supposed to have: steady, compounding growth, not a spike that vanishes the moment the switch gets flipped off.
Where the Site Stands Today
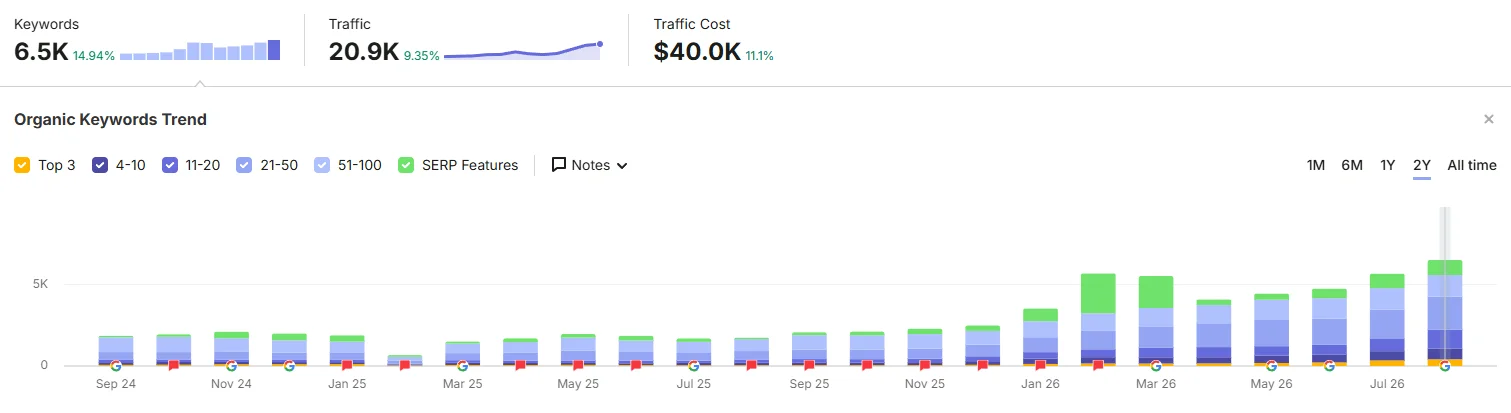
- Roughly 6,500 total ranking keywords, up 15% in the most recent tracking period, with more than 1,000 of those sitting in positions 1 to 10.
- 65.5% of ranking keywords are informational, the direct result of building content around the questions patients search before they book, rather than product and service pages alone.
- 6,400+ total backlinks from over 700 referring domains, a real authority base built without a single purchased or automated click behind it.
What That Traffic Is Worth
The previous vendor’s click volume can’t be used as an honest baseline. It was never real demand, so putting a dollar figure on it would only dress up a number that was already fake.
Instead, here’s what the real, organic-only growth is worth using the same market-price logic every paid-media estimate relies on: what it would cost to buy this same traffic through search ads instead of earning it.
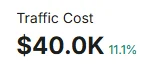
Using Semrush’s traffic-cost modeling (organic clicks weighted by the average CPC for those terms), the practice’s current organic traffic carries an estimated paid-media equivalent of roughly $40,000 per month. Scaled back to the click volume in the first 90 days after the transition, that same modeling puts the starting point at roughly $19,000 per month.
That’s an estimated $21,000 per month in additional media value the practice would otherwise have to spend on ads to replicate, and it’s still climbing.
Modeled, not client-reported. Based on Semrush’s organic traffic-cost estimate (organic clicks x average category CPC), scaled proportionally to tracked click volume across the comparison window. This is a paid-media equivalence, not booked revenue.
By February 2026, about two months into the new strategy, the client summed it up like this:
“We’re getting more new-patient calls than we know what to do with.”
The Main Takeaway
Riverbend Dental Group didn’t have a traffic problem. It had a traffic credibility problem: a dashboard full of numbers that never should have been trusted, sitting on top of a real practice with real locations and real patient demand that Google simply couldn’t find yet.
Once we replaced the fake volume with real coverage, real location pages, and a real Google Business Profile, the growth that followed wasn’t a spike. It was the practice finally showing up for the people already searching for it.
Client details have been changed for privacy. Performance data is unmodified.
Ready to find out what your real numbers look like?
If your current SEO reporting looks too good to be true, it might be. We’ll audit it honestly and build a strategy on traffic that actually turns into patients or customers. Get in touch with HeyTony for a search strategy built on what’s real.
Explore more work
Client details have been changed for privacy. Performance data is unmodified. When Veltura Media came to HeyTony for SEO services,…
How a Home Maintenance Company Went From 65% Brand-Dependent Traffic to a 95% Non-Branded Organic Engine (Client name changed for…